
Bitcoin market cap must rise to ARK Invest’s roughly $16 trillion 2030 base case, requiring about 78.6% annual growth from the current level; institutions and digital-gold adoption carry almost the entire scenario.
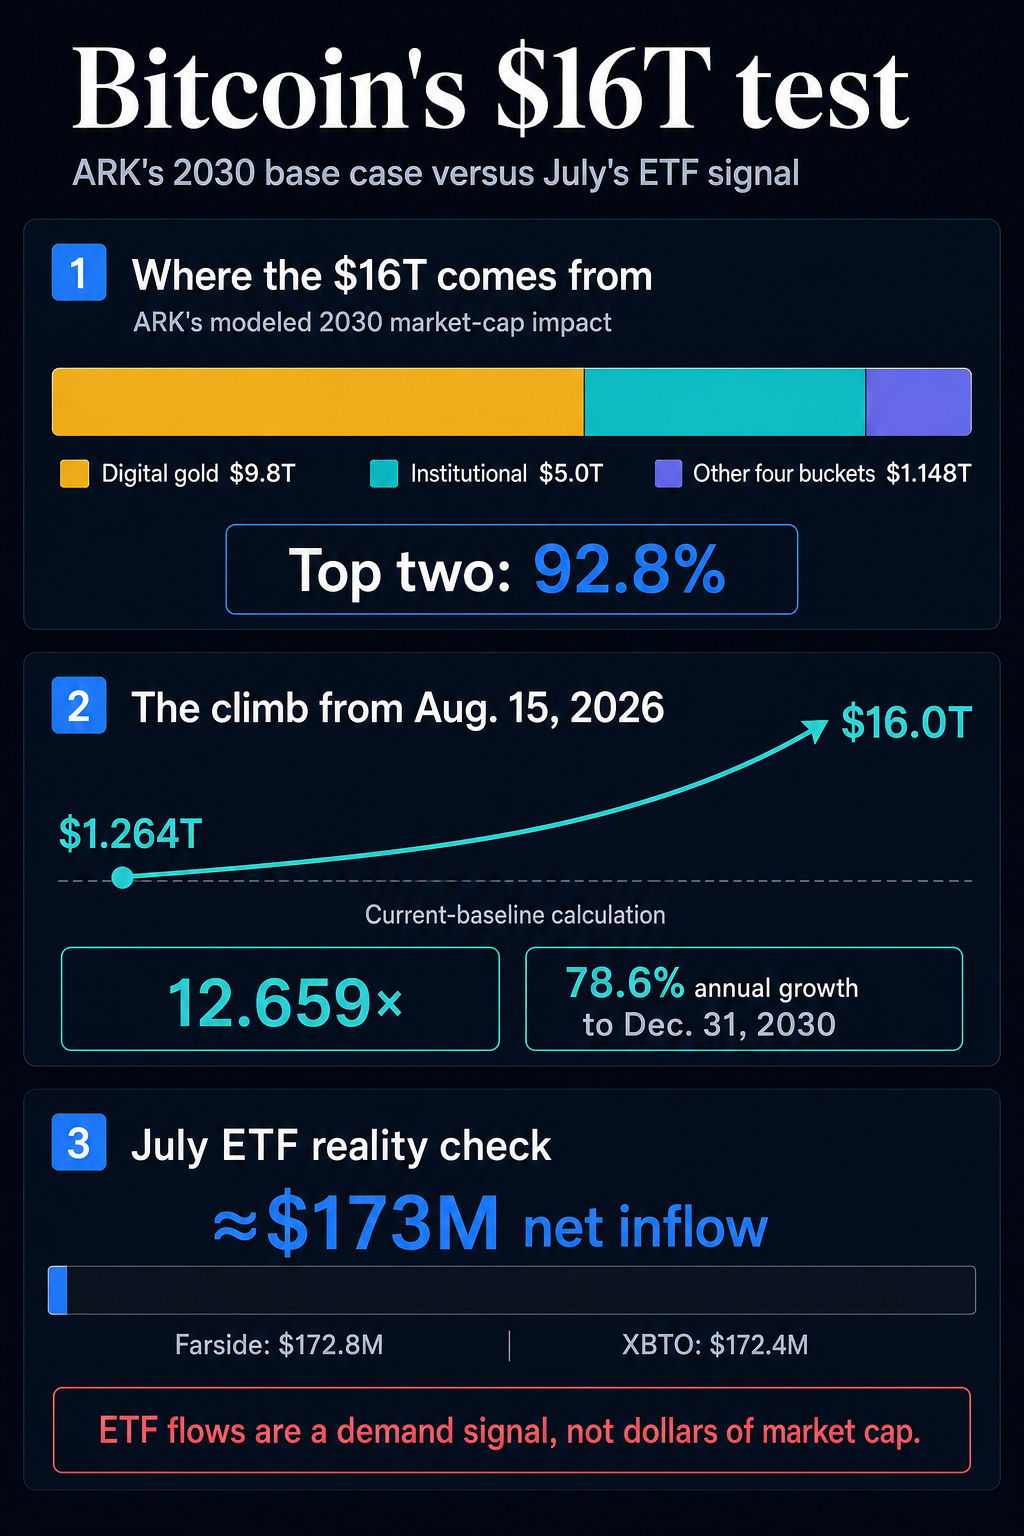
CryptoSlate’s Bitcoin market cap stands at near $1,263,920,244,537. Reaching $16 trillion by Dec. 31, 2030, from that point requires a 12.659-fold increase in a little over four years.
However, July 2026 spot-Bitcoin ETF flows expose weak demand in the most visible US institutional channel. The current Farside daily table sums to just $172.8 million of net inflows for US spot-Bitcoin exchange-traded funds. ARK’s scenario reaches far beyond one month and one access channel, but today’s lower market value has made the remaining climb steeper.
The model concentrates 93% of its value in two bets
Bitcoin market cap math: three starting points, three growth rates
ARK’s Big Ideas 2026 report states that Bitcoin could compound about 63% annually during the five years to 2030, rising from nearly $2 trillion to roughly $16 trillion.
Three different growth rates matter here because each uses a different starting point or clock.
ARK’s published 63% rate belongs to its own approximate model baseline. Treating the displayed endpoints as exactly $2 trillion and $16 trillion across five full years produces 51.6% annual growth. A 63% five-year rate ending at $16 trillion implies a starting value near $1.39 trillion. ARK uses rounded language and does not publish the unrounded input on the page, leaving the visible figures internally non-reproducible without more precision.
The 78.6% figure starts later and lower. It runs from CryptoSlate’s Aug. 15, 2026 snapshot through the end of 2030. It is a current-baseline calculation, separate from ARK’s stated rate.
In ARK’s additive framework, six demand assumptions generate about $15.948 trillion of modeled market-cap impact:
| Demand bucket | ARK base-case assumption | Modeled 2030 market-cap impact |
|---|---|---|
| Institutional investment | 2.5% of a roughly $200T global market portfolio excluding gold | About $5T |
| Digital gold | 40% of ARK’s $24.4T gold-market estimate | About $9.8T |
| Emerging-market safe haven | 0.5% of a roughly $68T emerging-market M2 base | About $339B |
| Nation-state treasuries | 2.5% of roughly $15T in global reserves excluding gold | About $375B |
| Corporate treasuries | 2.5% of roughly $7T in global cash and equivalents | About $172B |
| Bitcoin on-chain financial services | 40% annual growth from a roughly $35B market | About $262B |
Institutional investment and digital gold total $14.8 trillion, or 92.8% of the calculated base case. The model therefore succeeds or fails mainly on Bitcoin gaining a much larger role in global portfolios and in the monetary use case now served by gold. The other four buckets collectively account for 7.2%.

July exposes weakness in the US ETF channel
Meanwhile, Farside’s 22 July daily totals produce $172.8 million. XBTO reported $172.4 million and described July as the weakest positive month of 2026 through that point. The public sources give no reason for the $400,000 difference, making approximately $173 million the appropriate narrative figure.
For comparison, a mechanical annualization produces $2.07 billion, based on $172.8 million multiplied by 12. Monthly ETF flows can swing sharply, so that figure works as a scale comparison rather than a forecast.
Likewise, ETF net flow and market capitalization describe different market processes. ETF data measures creations and redemptions. Bitcoin market cap is the latest traded price multiplied by circulating supply. Marginal transactions can reset the price applied across that supply, allowing market value to move by more or less than the dollars entering an ETF.
ARK’s valuation methodology likewise builds terminal values from adoption rates, addressable markets and projected Bitcoin supply. Its $5 trillion institutional component represents a modeled value outcome from 2.5% penetration of a global portfolio. It does not specify $5 trillion of ETF subscriptions.
Still, the recent institutional evidence points to weak traction. BlackRock’s IBIT quarterly filing shows $4.286 billion of second-quarter contributions and $7.236 billion of redemptions, producing a $2.951 billion net decrease in assets from capital-share transactions. Those transactions can occur in kind, which makes the filing measure distinct from investor cash flow. IBIT’s shares outstanding rose just 0.4105% between June 30 and July 31.
Price response remains equally non-mechanical. ARK estimated that US spot ETFs and asset treasuries absorbed 1.2 times newly mined supply plus recirculated dormant Bitcoin in 2025. Bitcoin’s price still fell 6.2% that year.
Together, these observations make July a warning about one major route to ARK’s institutional target. They do not measure pension allocations, direct custody or the entire global portfolio in ARK’s denominator.

The biggest assumptions have the weakest visible bridge
Size and current observable traction make institutional investment and digital gold the most consequential risks.
The institutional case needs Bitcoin to reach 2.5% of ARK’s roughly $200 trillion global portfolio excluding gold. The US ETF channel currently supplies the most visible daily evidence, and July showed minimal net demand. A broader judgment needs multi-period ETF data alongside direct institutional holdings, treasury positions and other custody channels.
Digital gold carries more weight at roughly $9.8 trillion, yet its denominator remains open to interpretation. The World Gold Council valued all above-ground gold at about $31 trillion at the end of 2025 and classified more than $15 trillion as investable or financial gold. ARK uses a separate $24.4 trillion gold-market input. These figures describe different scopes, placing ARK’s denominator between the Council’s all-gold and investable-gold measures.
The base case ultimately needs evidence that Bitcoin is capturing monetary demand associated with gold, not merely benefiting from a larger gold valuation. ARK itself enlarged the digital-gold addressable market after gold’s market value rose 64.5% in 2025.
By contrast, ARK’s emerging-market assumption has already moved in the opposite direction. ARK cut base-case penetration from 2.5% to 0.5%, an 80% reduction, as stablecoins gained ground in developing economies. The International Monetary Fund estimated that gross cross-border USDT and USDC flows increased from $12 billion in the first quarter of 2020 to $316 billion in the first quarter of 2025, with a large share directed to emerging markets. That growth supports the competitive pressure behind ARK’s revision, while ARK alone supplies the exact 80% model adjustment.
Sovereign adoption remains a smaller, policy-dependent component. The US Strategic Bitcoin Reserve was established in March 2025 with forfeited Bitcoin as its initial funding. The policy directs officials to develop budget-neutral acquisition strategies, without mandating funded open-market purchases.
A separate bill that would require 200,000 BTC in annual purchases has been introduced but not enacted. That distinction leaves current US policy centered on retention rather than a scheduled bid.
Corporate holdings can move in both directions. In a July 6 Strategy filing, the company reported that it had sold 3,588 BTC for $216 million from June 29 through July 5 to fund preferred-stock distributions and replenish a dollar reserve. One company’s sale cannot measure the entire corporate bucket, but it demonstrates that financing needs can turn a treasury holder into a seller.

A falsifiable scorecard through 2030
ARK publishes an endpoint scenario. A smooth compounding curve from the Aug. 15 snapshot provides analyst-created monitoring markers for that endpoint:
| Observation date | Market cap on a constant path |
|---|---|
| Dec. 31, 2026 | $1.57T |
| Dec. 31, 2027 | $2.81T |
| Dec. 31, 2028 | $5.02T |
| Dec. 31, 2029 | $8.96T |
| Dec. 31, 2030 | $16.00T |
Bitcoin can overshoot or undershoot any single point. Two consecutive year-end misses, paired with flat or falling multi-period evidence for institutional allocation and digital-gold adoption, would make the base case materially less plausible because the required growth rate for the remaining years would rise.
The 2030 deadline supplies the hard test. ARK’s base case fails on its own terms if institutional penetration does not approach 2.5%, evidence remains incompatible with a roughly $9.8 trillion digital-gold component, and the six modeled impacts do not support a Bitcoin market cap near $16 trillion.
Interim institutional monitoring should use a rolling 12-month ETF window together with disclosed direct holdings and treasury positions. Digital-gold monitoring should track whether Bitcoin’s monetary role and overall capitalization are becoming consistent with ARK’s modeled component. Stablecoin use, sovereign acquisition policy, corporate net buying and Bitcoin financial-services growth then show whether the smaller buckets are adding support or introducing further shortfalls.
July’s approximately $173 million ETF inflow raises the burden of proof for the institutional path. The $16 trillion scenario now depends on visible acceleration across institutions and digital gold, while Bitcoin market cap must sustain a 78.6% annual climb from the Aug. 15 baseline.
The post Slowing ETF demand and corporate treasury selling are breaking the math behind Wall Street’s $16 trillion Bitcoin target appeared first on CryptoSlate.